Logs and Observability
TL;DR
Collecting different types of logs in a Linux environment with Promtail, push them to the Loki instance and displaying them graphically in Grafana.
Introduction
Efficient log management has become a key element. In this article, I will share my experience in successfully implementing a powerful triad: Promtail, Loki and Grafana, deployed on my Linux VPS.
Centralising and visualising logs not only improves monitoring, but also makes it easier to identify problems and make informed decisions.
The choice of Promtail, Loki and Grafana for this implementation is based on an effective synergy between these tools, providing a complete open source solution for log management and data visualization.
Do not forget to always keep your systems up to date.
Loki
In this step, I will focus on the installation and setup of Loki, the distributed storage system that will be the central repository for my system logs.
Once Loki is configured, I will be able to connect Promtail for efficient log collection and transmission.
Installation
Note: check the latest version in https://github.com/grafana/loki/releases/
# Go to the installation path
sudo cd /usr/local/bin

# Download the latest (for me: v2.9.1) loki from the official repository
sudo curl -O -L "https://github.com/grafana/loki/releases/download/v2.9.1/loki-linux-amd64.zip"

# Unzip the downloaded fail and make it executable
sudo unzip "loki-linux-amd64.zip"
sudo chmod a+x "loki-linux-amd64"

# Create the configuration file - we will come back here later
sudo touch config-loki.yml

# Create service file - we will come back here later too
sudo touch /etc/systemd/system/loki.service

# Create a specific user for the service we are going to create
sudo useradd --system loki
Configuration
Once all set up, I will need to configure both Loki config and service.
Loki config file /usr/local/bin/config-loki.yml:
In my case is very important to not keep logs for a very long period of time, so in the following configuration will see the retention settings enabled.
Moreover, I saw that Grafana had problems when indexing logs for more than a couple (2) hours.
This configuration already mitigates this problem too:
auth_enabled: false

server:
  # http://127.0.0.1:3100 => Grafana will connect to this port.
  http_listen_port: 3100
  grpc_listen_port: 9096

common:
  instance_addr: 127.0.0.1
  path_prefix: /var/lib/loki
  storage:
    filesystem:
      chunks_directory: /var/lib/loki/chunks
      rules_directory: /var/lib/loki/rules
  replication_factor: 1
  ring:
    kvstore:
      store: inmemory

query_range:
  results_cache:
    cache:
      embedded_cache:
        enabled: true
        max_size_mb: 200

querier:
  max_concurrent: 2048

frontend:
  max_outstanding_per_tenant: 4096
  compress_responses: true

schema_config:
  configs:
    - from: 2020-10-24
      store: boltdb-shipper
      object_store: filesystem
      schema: v11
      index:
        prefix: index_
        period: 24h

chunk_store_config:
  max_look_back_period: 168h

compactor:
  working_directory: /var/lib/loki/retention
  shared_store: filesystem
  compaction_interval: 10m
  retention_enabled: true
  retention_delete_delay: 2h
  retention_delete_worker_count: 150

limits_config:
  retention_period: 168h
  split_queries_by_interval: 24h
Service config file /etc/systemd/system/loki.service:
[Unit]
Description=Loki service
After=network.target

[Service]
Type=simple
User=loki
ExecStart=/usr/local/bin/loki-linux-amd64 -config.file /usr/local/bin/config-loki.yml

[Install]
WantedBy=multi-user.target
Once everything is set up, it is time to start the service and enable it for automatically start when the system reboots/starts:
sudo systemctl daemon-reload
sudo systemctl start loki.service
sudo systemctl enable loki.service
Promtail
It is essential to understand the crucial role that Promtail plays.
It will act as the log collection, responsible for collecting, processing and sendind logs to Loki (the distributed storage system).
Its main function is to ensure efficient and secure log collection from varios source points in your environment.
Promtail also allows:
- Collect logs from multiple sources on your systems, from local log files to distributed applications.
- Implement a dynamic tagging system, allowing you to associate specific metadata with each log. This makes it easy to search and filter relevant logs.
Installation
Note: check the latest version in https://github.com/grafana/loki/releases/
# Go to the installation path
sudo cd /usr/local/bin

# Download the latest (for me: v2.9.1) promtail from the official repository
sudo curl -O -L "https://github.com/grafana/loki/releases/download/v2.9.1/promtail-linux-amd64.zip"

# Unzip the downloaded fail and make it executable
sudo unzip "promtail-linux-amd64.zip"
sudo chmod a+x "promtail-linux-amd64"

# Create the configuration file - we will come back here later
sudo touch config-promtail.yml

# Create service file - we will come back here later too
sudo touch /etc/systemd/system/promtail.service

# Create a specific user for the service we are going to create
sudo useradd --system promtail

# Grant permissions to the created user so it can read system log files
sudo usermod -aG adm promtail
Configuration
Once all set up, I will need to configure both Promtail config and service.
Promtail config file /usr/local/bin/config-promtail.yml:
This file will depend in what you want to collect. For me there are several paths and applications that I want to monitor:
- Logfiles under:
/var/log/- I will add them a label:
job: logsso it is easier to find the results in Grafana afterwards. - As all the files are wanted a
*is set.
- I will add them a label:
- NGINX service
- I will add them a label:
job: nginxso it is easier to find the results in Grafana afterwards. - I will add the
accessanderrorlogs, which are located behind/var/log/nginx/.
- I will add them a label:
Also, it is worth saying that the URL must be the indicated in the following configuration, since Loki receives logs in the /loki/api/v1/push endpoint.
server:
  http_listen_port: 9080
  grpc_listen_port: 9097

positions:
  filename: /tmp/positions.yaml

clients:
  - url: http://localhost:3100/loki/api/v1/push

scrape_configs:
  - job_name: system
    static_configs:
      - targets:
          - localhost
        labels:
          job: logs
          __path__: /var/log/*log
  - job_name: nginx
    static_configs:
      - targets:
          - localhost
        labels:
          job: nginx
          __path__: /var/log/nginx/*log
Service config file /etc/systemd/system/promtail.service:
[Unit]
Description=Promtail service
After=network.target

[Service]
Type=simple
User=promtail
ExecStart=/usr/local/bin/promtail-linux-amd64 -config.file /usr/local/bin/config-promtail.yml

[Install]
WantedBy=multi-user.target
Once everything is set up, it is time to start the service and enable it for automatically start when the system reboots/starts:
sudo systemctl daemon-reload
sudo systemctl start promtail.service
sudo systemctl enable promtail.service
Grafana
We have now reached the third and last point of this article, and perhaps the most expected one.
Now it is time to show all this configuration in a visual way, and that is Grafana’s job.
And take a look, it is super easy!
Installation
Note: check the latest version in https://grafana.com/grafana/download?edition=oss
Following the official steps:
sudo apt-get install -y adduser libfontconfig1 musl
wget https://dl.grafana.com/oss/release/grafana_10.1.4_amd64.deb
sudo dpkg -i grafana_10.1.4_amd64.deb
sudo systemctl start grafana-server.service
sudo systemctl enable grafana-server.service
Configuration
The remaining configuration will be done via GUI so you you now can access your Grafana in: http://localhost:3000/.
If you are trying it in a VPS as I am, you always can port-forward Grafana Server and access it through the internet.
Assuming you are using a Load Balancer or a Reverse Proxy, I recommend you to visit the following official link: Grafana behind a Reverse Proxy.
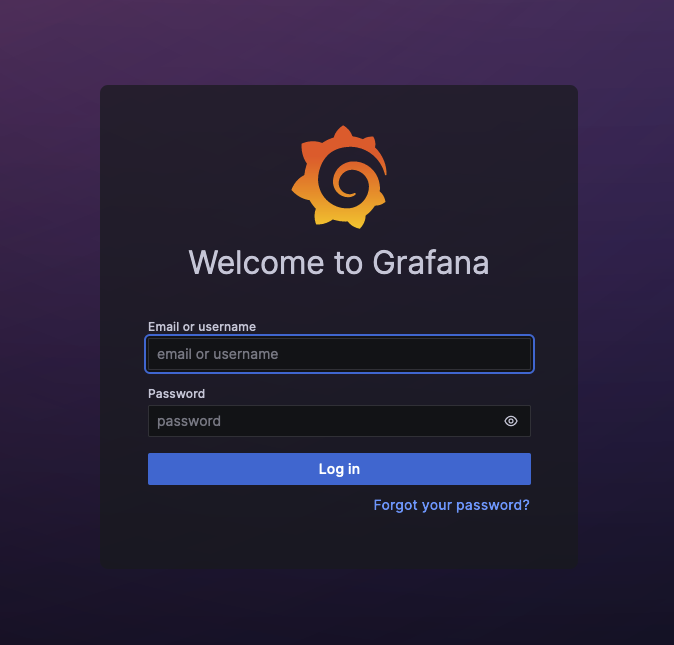
- Log in with
admin:adminand you will be asked to change the password. - Now go to
Connections, you will be find it in the left menu. - Click on
Add new data source>Loki. - Set the default URL:
http://localhost:3000. - Click on
Save & test.
This should be enough for having fun and start searching your logs.
Testing and Adding Dashboards
Queries
By accessing Explore in the menu on the left, you will find a panel dedicated to query logs.
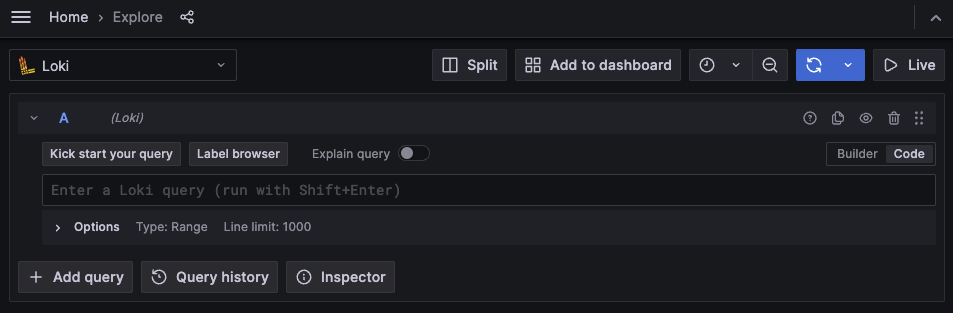
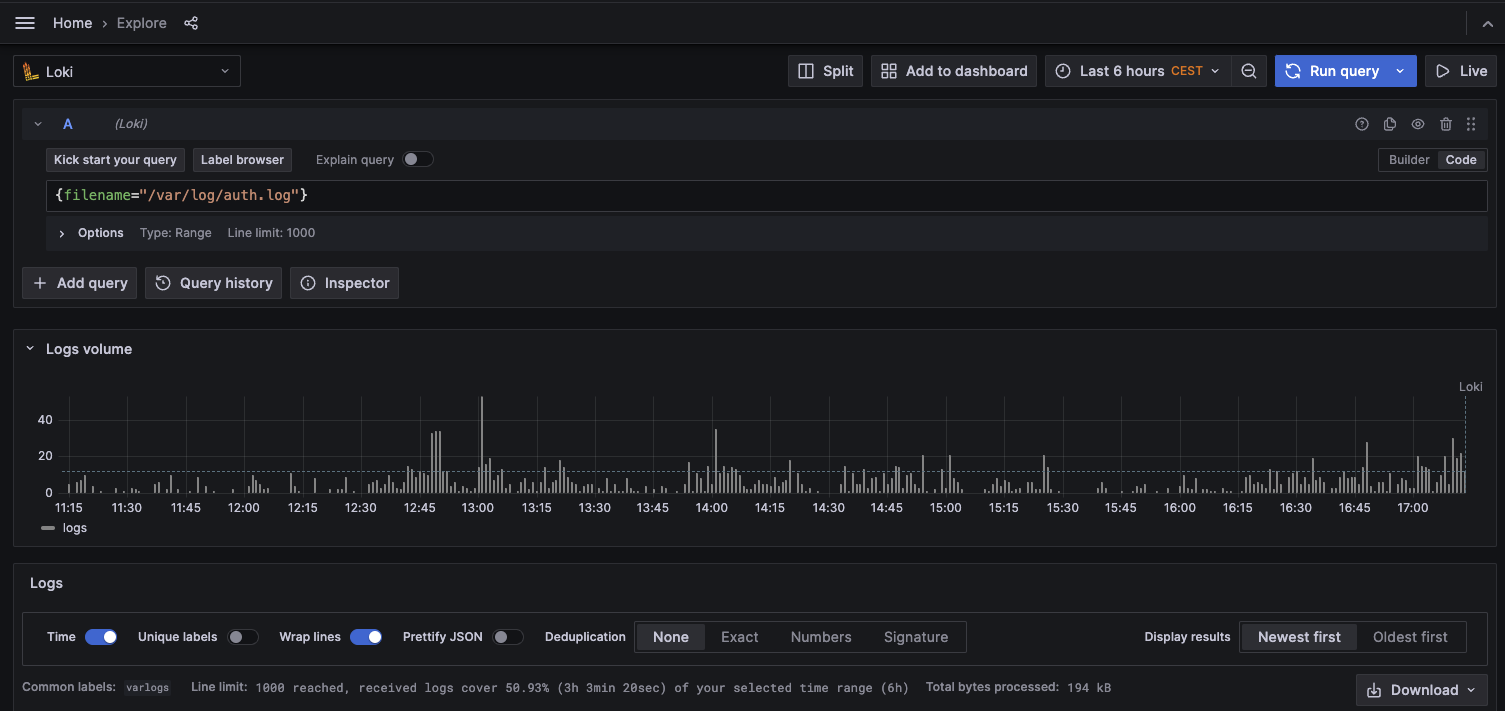
You can do a test and filter thanks to the labels (job: <value>) that we have defined previously in the Promtail configuration or by filename, for example you can show all the logs related to the Login (/var/log/auth.log).
For this:
{filename="/var/log/auth.log"}
You can even query the /var/log/syslog with:
{filename="/var/log/auth.log"}
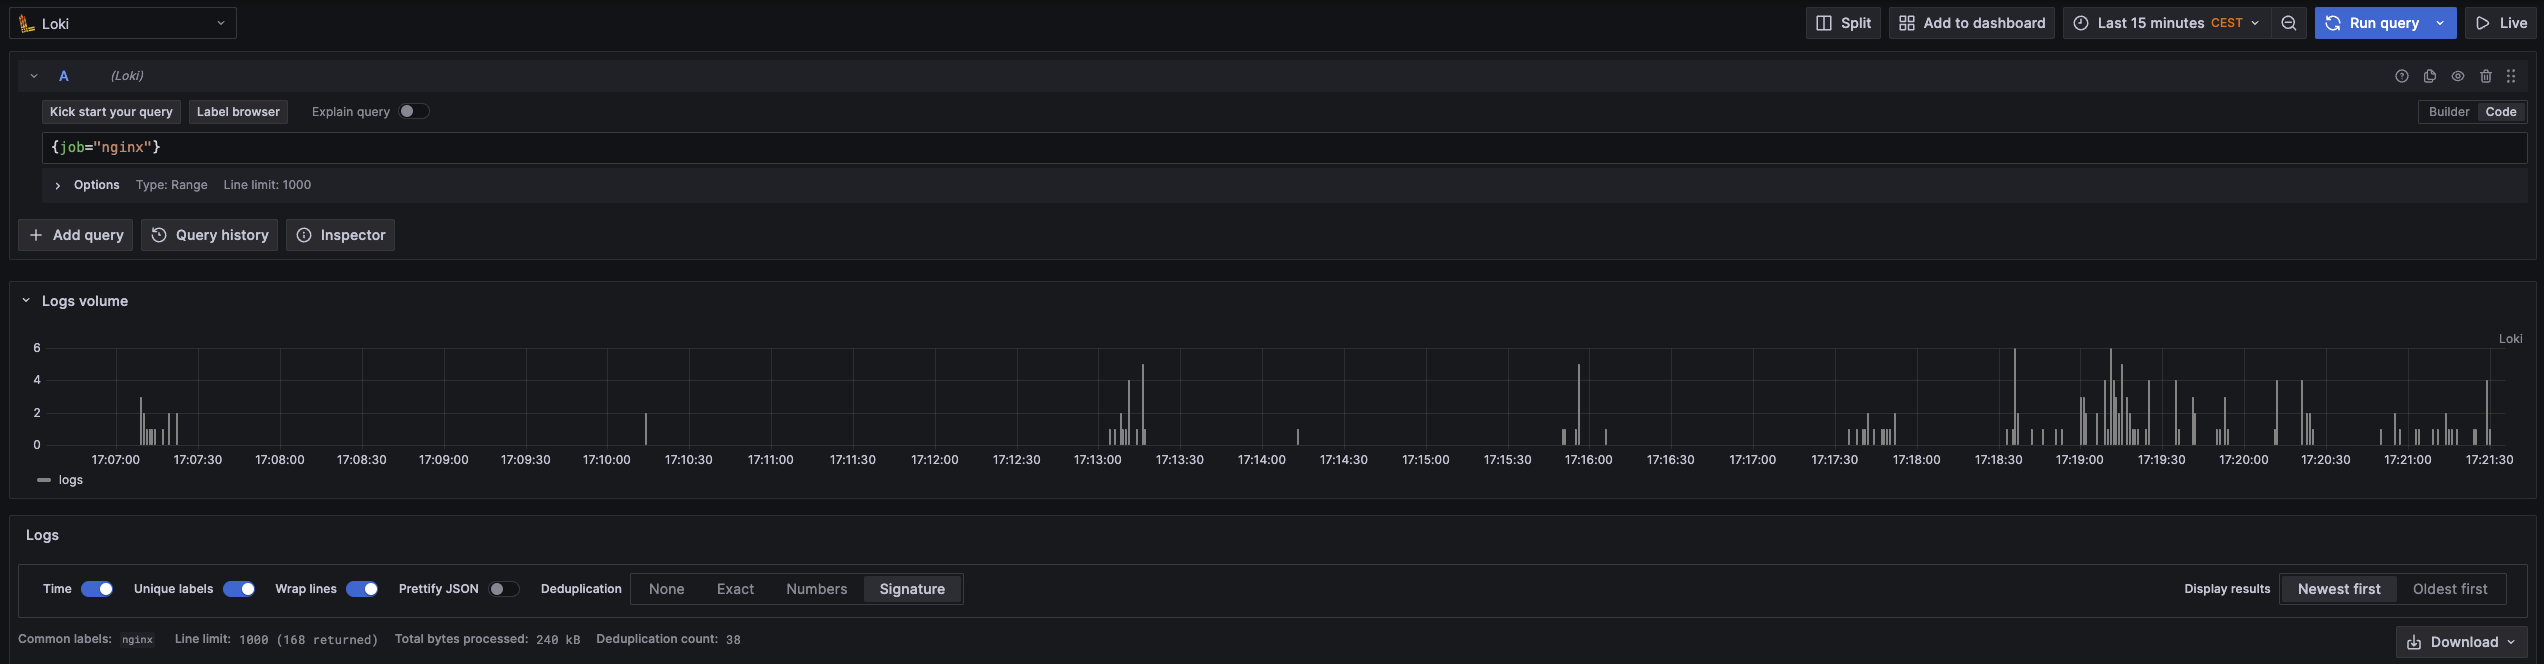
On the other hand, if you want to use the job defined, you just need to apply the following:
{job="nginx"}
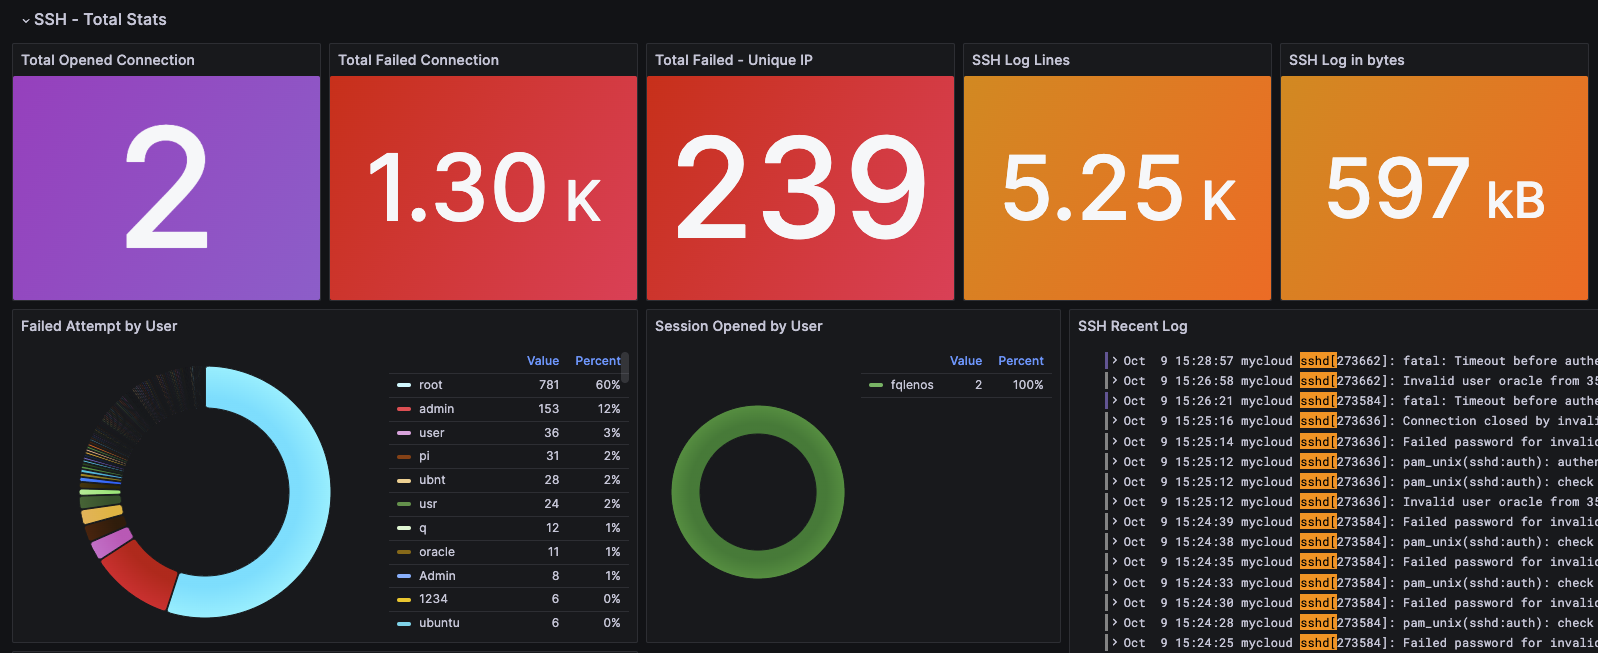
Dashboard
But well, when talking about Grafana what we are looking for is to visualize all this in a nice way.
We are going to include a dashboard created by the community that will help us to start.
For this:
- Access to
Dashboardsin the menu on the left. - Select
New>Import. - Add the following ID:
17514.- You can also find the Dashboard JSON in SSH-Logins
- Click on
Load.
Yay! You have it.